In consulting, every day is about spreadsheet and presentation slides. Also known as “deliverables”, this electronic visual document is used to deliver information to customers while pitching, providing project updates, or sharing the end results, in a clear, compelling, and engaging way.
The article is going to analyse what makes an MBB-standard slide deck, including its structure, fundamental elements, and formatting tips.
Table of Contents
What is the structure of an MBB slide deck?
An MBB-standard slide deck consists of 5 sections: title page, executive summary, contents and exhibits, key takeaways, and appendices.
Section 1: Title page
Title page is the first slide, representing the purpose of the whole deck. It consists of a title, a headline, name of company, date and time. The title is usually less than 10 words long. It answers the question “What is the presentation about?”. A headline is an optional second description line, used for further elaboration.
Name of company depends on the owner of the slide deck, not who made it. If it belongs to the consulting firm’s authority, the slide will have that company’s name and use its signature colour-font scheme. Vice versa, if it is made for clients, the slide is owned by that organisation, using its logo and own design. Normally, the in-house designer will have a template in advance, the consulting firm only needs to insert data. When finished, the slide deck will be forwarded to the VGI centre for the final touch.

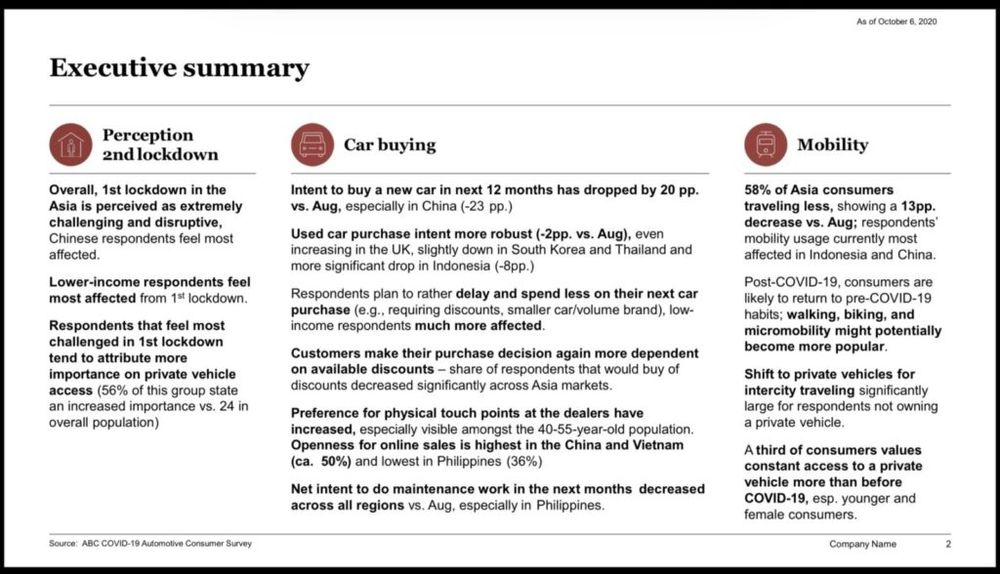
Section 2: Executive summary (or At a glance)
Executive Summary, or also called At A Glance, briefly summarises the presenting “story” with key points of the slide deck. Based on the purpose of the presentation, the content in the Executive Summary varies. Normally, it gives a snapshot of key initiatives in the strategic plan, company capabilities in the business proposal, customer profile, business updates in review meetings, or merely a project summary. This helps readers, who have no time to read them all, be able to scan only the Executive Summary for overview and take away the most important insights. Due to its nature, usually, the Executive Summary takes the most time to write.
Section 3: Contents and exhibits
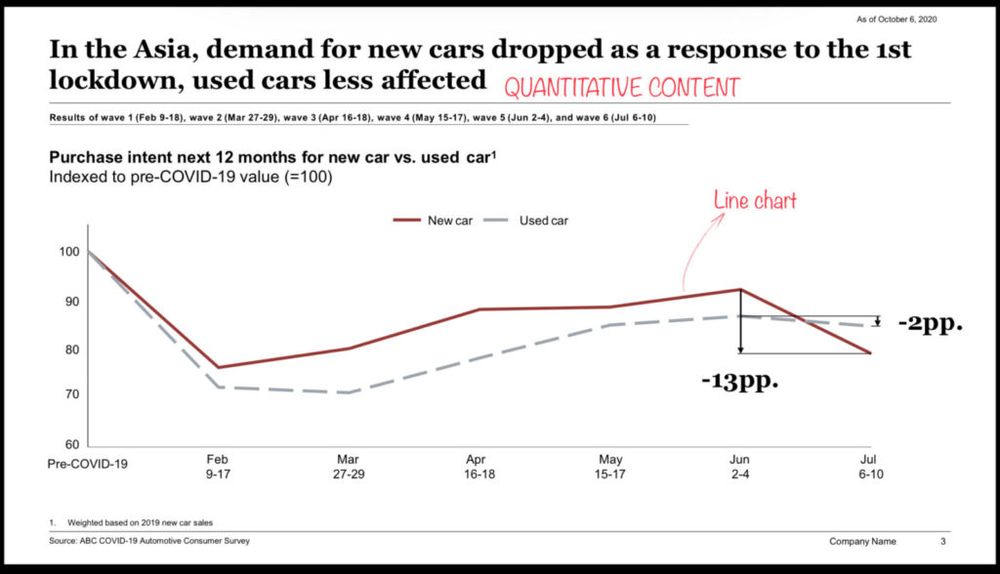
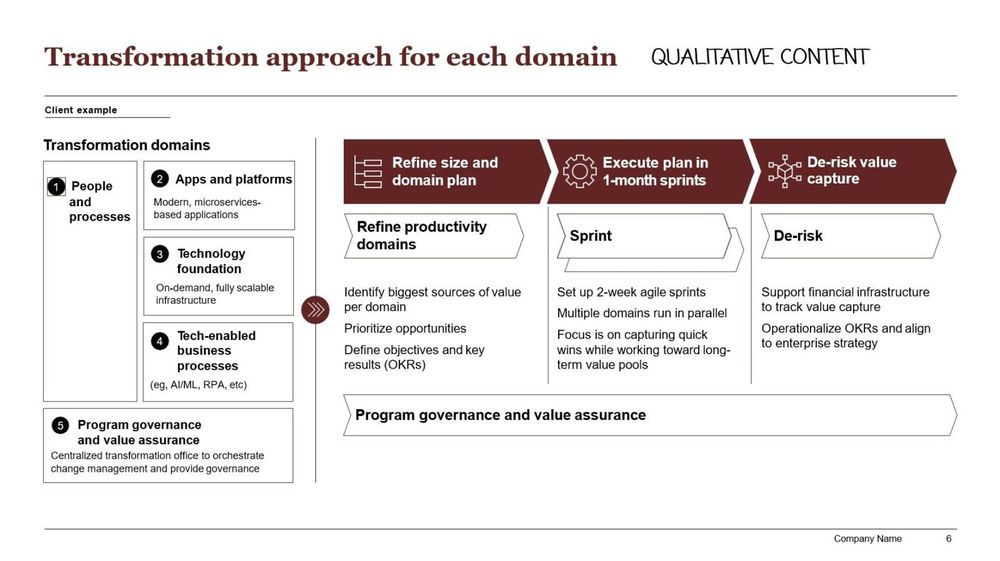
The primary purpose of slide deck is to visualise data in a clear and compelling style. Typically, there are 2 types of data in a presentation:
- quantitative content, which will be converted to charts, and
- qualitative content, which will be presented with diagrams or concept maps.
Specifically, to quantitative content, there are 6 chart families: bar/column family, line chart family, percentage family, Mekko family, scatter plot family, and waterfall family.
Content and Exhibits is the central section of the whole deck, where it decides if the presentation is well-qualified or not. There are 2 approaches that help keep the flow in a structured but engaging fashion: (1) Vertical Flow, which focuses on the key takeaway of each slide by applying Pyramid principle and MECE fashion, and (2) Horizontal Flow, which concentrates the storyline of the slide deck by connecting all titles to a meaningful story.
Section 4: Take action or recommendations
Take Action, or Recommendation, is a conclusion with proper solutions for addressing issues, usually containing more than one slide with supporting quantitative and qualitative data. In consulting culture, result-oriented is the fundamental mindset, of which every decision must clearly show the outcome/ impact. So do the MBB slides.
Section 5: Appendices (optional)
Appendices section is supplemental material added at the end of the deck, composed of additional slides and information that do not include during a pitch. This section is optional, some decks have it but some don’t. They are usually detailed and back up such as data, process clarifications, additional charts or testimonials for further researching. Packing slides with loads of information only get audiences jumbled in details and miss the big picture. Therefore, incorporating appendix slides at the end of deck will keep the slides clean but still have backups to flip back if questions arise.
What are the key components of an MBB slide?
Top of slide – Title
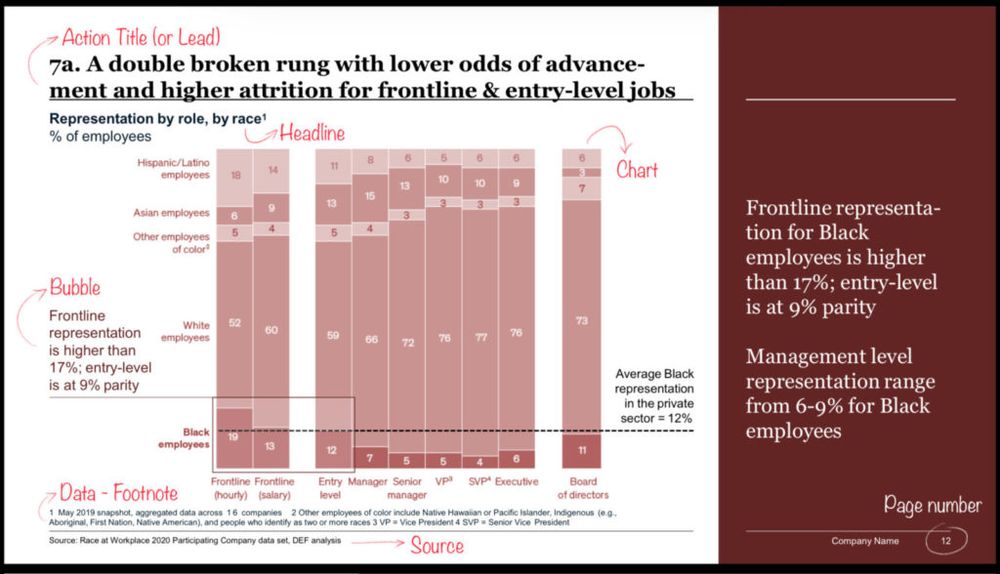
- Action Title (or Lead) is a short summary of about 5-6 words, displayed at the top of the slide, in charge of 2 things: (1) represent the main ideas of the slide itself, and (2) direct the reading flows of the slide deck as a whole. The title should be specific and straightforward, rather than a generic one. For example, use “…” instead of “Market Size”. More importantly, it should make sense when it stands alone as well as when connected together in the presentation.
- Headline is an additional 10-word description down below the Action Title, in charge of supplementing ideas or explaining further the context of slide or just merely giving units of data.
Middle of slide – Chart
- Charts, there are 6 chart families: bar/column family, line chart family, percentage family, Mekko family, scatter plot family, and waterfall family.
- Legend, also called the graph series, is an area of chart describing metrics of charts, appears as a box to the right or left of the graph.
- Bubble (or callout): is an attached message, giving additional information in front of an element, and is usually used to state what has not yet included in the analysis.
- Stickers: normally displayed at the top right of the slides, working as a note for the purpose of the slide. Common stickers are (1) “For Discussion” – means the representing data and statements are quite controversial that need more discussion from listeners; (2) “Preliminary” and “Highly preliminary” for those slides that have not come to the final conclusion; (3) “Indicative” implicitly shows that the given numbers are not 100% accurate but gives a good direction/the right picture for the slide deck; and (4) “Illustrative” to note that data are precisely true but rather hypothetical numbers, showing the relationship among variables.
Bottom of slide – Additional information
- Date: is the current date of making slides, stays at the bottom of the slide. Slide is not always for presenting, sometimes it circulates within the firms for referencing, the created date line helps readers know exactly when the slides are made and if the given fact/statement is suitable or not.
- Footnote is an additional explanation for the designated data above it, which is no need for onscreen presentation, placed at the bottom of slide.
- Page number & On-page tracker are for readers to easily keep track during the presentation, and able to refer to if needed.
- Sources are usually cited below the footnote, showing the credibility of the shown data as well as giving proper credit to authors. Besides, it helps readers locate the sources for further research.
Managing the flow of contents within a slide
It is important to keep a smooth flow within each slide and throughout the deck, making it easier and more enchanting to follow the slides. There are 2 main flows:
Vertical flow
Vertical flow is applied for the slide itself. This approach focuses on the purpose of each slide: “Why is the data meaningful to the situation?”, “What is the takeaway?”.
To fully and efficiently deliver the information, besides the basic elements mentioned above, each slide must consist of 3 main parts: (1) KEY MESSAGE as headings; (2) MAIN ARGUMENTS as subheadings; and (3) SUB-ARGUMENTS with SUPPORTING DATA for deeper analysis in form of charts.
The structure of each slide can be drafted based on the Pyramid principle in a MECE fashion. The Pyramid Principle is an approach for creating a logical and structured storyline, backed up by data. Quite similar to Issue Tree, a Pyramid starts with an introduction mentioning the issue and answer, and the rest are arguments to support the answer. Meanwhile, MECE means “mutually exclusive, collectively exhaustive” – breaking down items into small pieces without overlapping and no gap.
Besides, try to avoid clotheslines. It is a long list of bullets with no illustration, which is usually assumed as not structured but rather displayed in a random style. A solution is to group these bullets into big categories, with sub-arguments if needed, to show a MECE and strategic structure.
Horizontal flow
Horizontal flow is a story-based approach that concentrates on the slide deck as a whole. It helps connect all slides to make a meaningful flow and grab the audience’s attention. There are 2 basic steps:
- Step 1: Draft your data by sketching all ideas, arranging them chronologically, and connecting titles into a story flow. This plan is called “Mickey Mouse Master” or “straw-man”
- Step 2: Make slides based on the sketch. Consultants can both do it themselves, or hand it over to a specialised department called the VGI centres.
Tips on how to read MBB slides
Consultants have to read mountains of decks at a time. Literal mountains. Hundreds of slides. On Friday nights. However, way too little time they have to read them all. Therefore, a smart approach is extremely necessary, to digest the most knowledge from those slides in the shortest time. Here is how a typical consultant will do:
After being assigned to a project, the very first thing to do is to find all materials. Normally, consultants will go straight to the company content library. At McKinsey people call it PD – Practice Development, which contains all documents of internal research and findings from previous client work.
Usually, these materials are in form of slides, which are organised in a structured and MECE fashion, which helps the reading process easier and faster. However, to read them efficiently, skim and scan in a top-down fashion. The order is to read the Executive Summary first, then Index, Titles, and Leads. This approach helps cover the fundamentals of the topic and easily spot out the right position of one specific
During the researching process, there are parts that consultants need to turn back the source and do some deeper research. With that previous skim-scan, consultants can easily spot the exact position of that section immediately.
Sometimes, when information from PD sources is rare, consultants can get additional information from the internal network, This will help find out similar projects that have done elsewhere in the world and contact the key personnel in charge of them. One significant point about the MBB network is that either that colleague already left the firm or still working, they are all super supportive and willing to help at their best. Consultants can have a call with the authors who made those slides to ask for more information. Normally, they will provide additional raw data files, or simply explain via phone.

Tips on how to write MBB slides
#1. Have a top-down mindset. It is an analysis approach, found across the consulting industry, that goes from general to specific, focusing on identifying the big picture and all of its components. Especially in making slides, this helps structure the content systematically to communicate effectively and drive decision-making.
#2. Do Ghost Deck first. This is an early draft of a PowerPoint deck, planning only titles and headlines to create a meaningful storyline in advance. In addition, there can be some quick sketches of exhibits such as tables or graphs in this draft. Ghost Deck is used as a work plan, aligning on the approach and direction to get to the final version while minimising wasted work. Once the team or client agrees with the storyline, the rest of deck then continues to develop.
#3. Ensure writing concisely and wording professionally. As consultants have so little time to read all the material, a to-the-point consulting writing style will help ease this process. Besides, the use of words in slides are extremely important. Therefore, make sure to use the right consulting terms in the right place.
#4. Keep the Vertical Flow in each slide and Horizontal Flow in the whole deck. This ensures each slide defines the key issues clearly and persuasively, as well as organises a meaningful storyline and keeps a logical but engaging flow throughout the deck.
#5. Every content exhibited on slides must be data-supported. An argument is regarded as gibberish when it is not proven by credible evidence. Evidence can be hypothetical, anecdotal, testimonial, or statistical, visualised in forms charts, diagrams or tables.
#6. Every title must be specific and detail-oriented. Titles are the key takeaways of the slide itself and the whole deck, where consultants pay their foremost attention to quickly skim-scan the content before reaching deeper. Therefore, they must be clear and straightforward to deliver the right message in the shortest time.
#7. Every chart must have measurement units and source citation as it makes the visualised data meaningful and gives credibility to the chart itself. Unit is usually noted below the title of charts, while the source is cited at the end of the slide. Also, in case readers want to do further research, a citation of source will help them trace back to the original version much easier and faster.

Tips on how to format MBB slides
- Reach out to VGI. This is a Design Centre at McKinsey that specialises in creating MBB-standard slides. Consultants only need to draw up ideas, frames, or sometimes a complete slide with dummy text on papers, in other words, the Mickey Mouse Master. Take a picture. Send it to India. Set a deadline. Include a charge code of our project. 99.9% of the time, the VGI will send back output perfectly on time. This is the fastest and most guaranteed way to get a flawless well-qualified slide deck.
- Be meticulous. Consultants themselves must hold extremely high standards of everything to make sure every bullet, every spacing, every detail is on point, even if they are done by the VGI or not.
- Same elements on different slides at the exact position. This helps keep consistency among all slides. In order to do this, one way is to duplicate that slide, then fix the remaining elements. Another way is to select that element, copy it, then go to a new slide, and press paste, it will be shown at exactly the same spot as the previous one.
- Bold for highlight is a great way to emphasise key elements or important ideas, attracting readers’ attention.
- Have a consistent format scheme of colour, font, and size for an even look. This depends on the owner of the deck – the consulting firm itself or the client – to follow its scheme. Specially, to some clients, the in-house designer will have a template in advance, the consulting firm only needs to insert data.
- Consistent alignment of top – bottom – left – right and leave a small margin around slides, avoid missing information.
- Line spacing in between bullets and paragraphs to improve scannability.

Terminology & Recap
- Deck, or “PowerPoint presentation”, is a series of slides about one specific topic, used in almost every consulting situation, including final reports, formal presentations, and detailed analysis documents.
- Ghost Deck is the skeleton of the whole deck, consists of titles and headlines only. Most ghost decks are blank, however, some include rough sketches of exhibits (tables, graphs, etc.). Ghost Deck drafts out the storyline before going into details, helps minimise wasted work if there is any popup change in data.
- Executive summary is a summary, briefly recapping the most important insights of the presentation, placed as the second slide in the deck (after the Title Page).
- Appendix, also referred to as “back-up pages”, is a supplemental section of additional data that do not include during the pitch, placed at the end of the deck.
- Mickey Mouse Master, or “straw-man”, is a draft of a presentation, presenting the Ghost Deck on a 3×3 grid paper.
- VGI is a support centre at McKinsey, in charge of creating an MBB-standard slide deck by request. Consultants can send their Ghost Deck with specific data to the VGI office, give further explanation or requirement if needed, at set a deadline. The VGI office will take the request and send back the presentation to further touch if needed.
- Action Title is a short summary, about 5-6 words long written in a concise and to-the-point fashion, representing the key ideas in a meaningful story flow. It is placed at the top of the slide.
- Lead is an additional description presenting supplementing ideas or further explanation of the slide, placed below the Action Title.
- Legend is an area of chart describing its metrics, explaining characters, symbols, or marking patterns that are usually unfamiliar to readers, placed as a box to the right or left of the graph.
- Bubble, or “callout”, is an attached message, giving additional information in front of an element, and is usually used to state what has not yet included in the analysis.
- Sticker is a note stating the purpose of individually that specific slide, placed at the top right of it. Common stickers are “For Discussion”, “Preliminary”, “Indicative”, “Illustrative”.
/filters:quality(75)//case_thumb/1669622680631_ultimate_management_consulting_program_3.png)